Current Month - Accounting View
Widget | Description | Sample(click to enlarge graphic) |
|---|---|---|
| Days Production in A/R | The number of days for which you have open balances in the A/R. |  |
| Net Collection Percentage | The percentage of net receivables. | 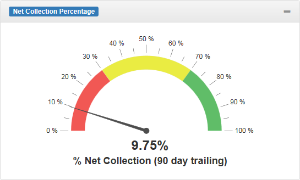 |
| Percent of A/R over 90 Days | The percentage of account receivables in A/R more than 90 days. | 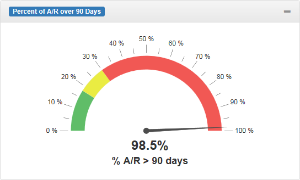 |
| Payer Mix (Charges) | The breakdown of payers associated with the claims for the current month. |  |
| Payer Mix (Payments) | The breakdown of payers associated with the payments for the current month. | 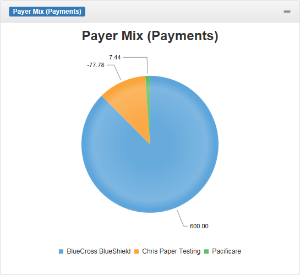 |
Prior Month - Date of Service View
Widget | Description | Sample | |
|---|---|---|---|
| Anesthesia Minutes by Provider | A breakdown of the minutes per provider. The color coding indicates if the minutes are Directing, Directed, or Observing activity. | 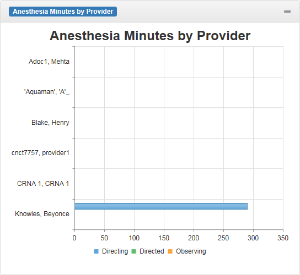 | |
| Anesthesia Units by Payer | A breakdown of the anesthesia units charged per provider. The color coding indicates if the units are Base Units, Time Units, or Physical Status Units. | 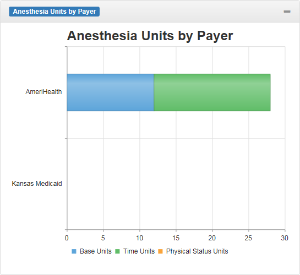 | |
| Rendering Provider Case Count | A count of cases per rendering provider. | 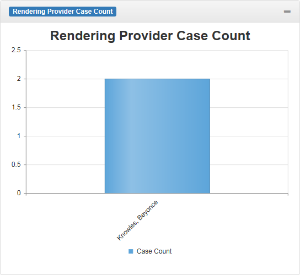 | |
| Billed vs. Expected vs. Collected | A breakdown of the billed, expected, and collected amounts per payer. The color coding indicates if the data amount is Billed, Expected, or Collected. | 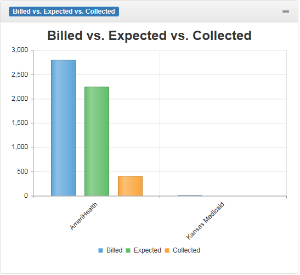 | |
| Payer Mix (Charges) | The breakdown of payers associated with the claims for the prior month by dates of service. | | |
| Payer Mix (Payments) | The breakdown of payers associated with the payments for the prior month by dates of service. | |